Data analyst is one of the most practical gateway roles into data and AI. It sits at the intersection of business, technology, and decision making. It is also changing fast.
If you are a beginner in 2026, you are right to ask two questions.
Is data analyst still a good role to pursue in 2026
If yes, what skills should I learn and in what order
Here is the honest answer.
Yes, data analyst is still a strong career path in 2026, but only for people who are willing to become more than a report builder. The market is moving away from analysts who only pull numbers and make basic dashboards. The market is moving toward analysts who can solve problems, collaborate with stakeholders, and translate data into actions that improve revenue, reduce cost, or reduce risk.
This blog gives you a practical road map you can follow as a beginner. It focuses on three things.
Skills that are consistently demanded across roles
A week by week study plan you can actually execute
A portfolio strategy that proves your skills to employers
No hype. No shortcuts. No pretending that a five minute dashboard equals a high paying job.
If you follow this road map with discipline, you will build real capability and a credible portfolio over the next four to six months.
What a Data Analyst Does in 2026
A data analyst helps a business make better decisions using data. That sounds simple, but it includes several layers of work.
- You collect and access data from systems
- You clean and shape the data into usable form
- You analyze the data to find patterns and drivers
- You communicate insights so non technical stakeholders can act
- You measure outcomes and refine decisions
In many companies, the modern analyst also touches parts of data engineering and automation. You might not be building full pipelines like a data engineer, but you are expected to understand where data comes from, how it moves, and why it can be wrong.
A good way to think about the role is this.
A data analyst is a business problem solver who uses data tools.
The tools matter, but the problem solving mindset matters more.
The Reality Check Most Beginners Need
Before you start learning, you need a clear picture of the field.
This path requires consistent effort. A realistic expectation is about four hours of focused study most days for four to six months. Some people will do it faster, some slower. What matters is consistency and practice.
Also, the field is competitive. That is not meant to discourage you. It is meant to keep you out of a common trap.
The trap is consuming tutorials and feeling like you are progressing, but never building proof of work.
In 2026, proof matters. Employers want to see that you can do the job, not that you watched lessons.
So this road map is designed with two parallel tracks.
You build skills
You show skills through projects, writing, and portfolio artifacts
If you only build skills without showing them, you will struggle to get interviews.
The Skill Stack You Need as a Beginner
Think of your skills in two buckets.
Technical skills
Core skills
You need both. Technical skills help you work with data. Core skills help you create value with data.
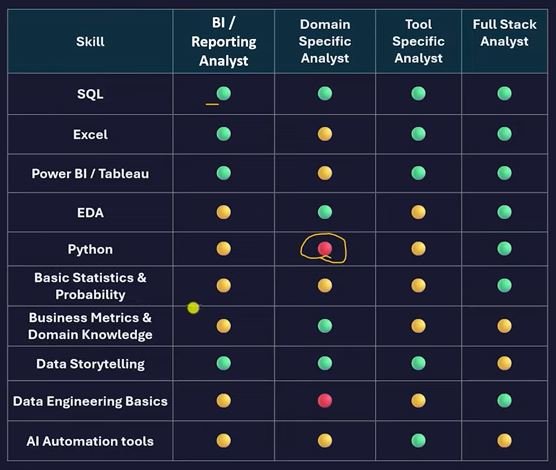
Technical skills that show up again and again
- Excel foundations and advanced analysis
- A BI tool such as Power BI or Tableau
- SQL for querying databases
- Basic statistics and business math
- Python basics and pandas for analysis
- Data modeling fundamentals
- Data cleaning and transformation
- Basic data engineering awareness
- Cloud basics at a familiarity level
- Automation basics using no code or low code tools
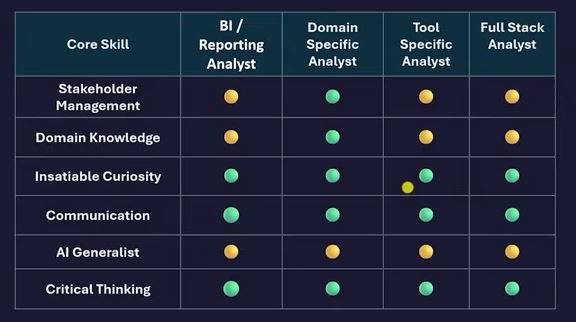
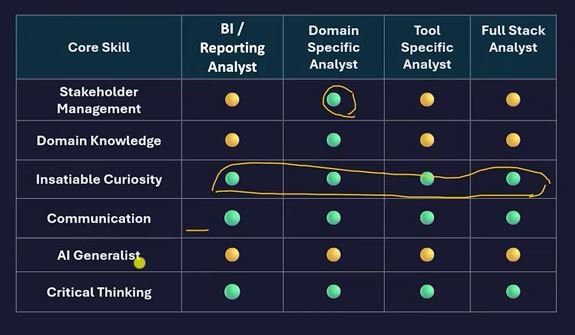
Core skills that separate strong candidates in 2026
- Problem solving and critical thinking
- Communication that is clear and structured
- Data storytelling and insight writing
- Stakeholder management and expectation setting
- Domain knowledge and business context
- Curiosity and self learning habit
- Presentation skills
- Collaboration across functions
If you want one sentence that explains the modern job.
Technical skills get you into the room. Core skills get you hired and promoted.
Four Common Categories of Data Analyst Roles
As a beginner, you should know that data analyst is a wide umbrella. Job titles vary by tool, function, and domain.
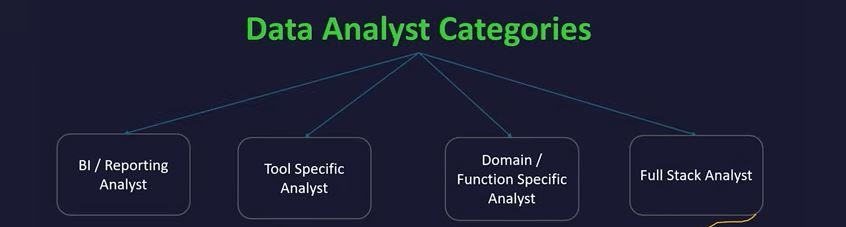
Here are four major categories you will see in job postings.
BI reporting analyst
These roles focus on creating standard reports that the business already uses. You might see titles like reporting analyst or MIS executive. The work often includes building recurring dashboards and distributing reports.
This category is beginner friendly because the scope is clearer and the work is often repeatable.
Tool specific analyst
These roles focus on one BI tool deeply. You might see titles like Power BI developer or Tableau developer. You build dashboards, create semantic models, write calculated measures, and manage publishing workflows.
This category is also beginner friendly, especially for junior roles, as long as you show portfolio proof.
Domain or function specific analyst
These roles require domain knowledge. Examples include marketing analyst, finance analyst, retail analyst, supply chain analyst, and operations analyst.
If you understand the business KPIs of a function, you gain an advantage. In 2026, domain knowledge is a strong differentiator because it helps you produce insights that matter.
Full stack analyst
This category is growing. It blends analytics with basic engineering awareness. You understand how data is ingested, transformed, stored, and served to dashboards. You might work with cloud tools, a warehouse, and a transformation layer.
You are not expected to be a full data engineer as a beginner, but familiarity gives you a big advantage, especially in smaller teams and fast moving companies.
The Mindset That Makes This Road Map Work
Before we jump into the plan, you need two mindset shifts.
Stop chasing tools as a goal
Tools are not the goal. Problem solving is the goal. Learn tools as part of solving problems. Your tool choice might change later, but your problem solving skill stays valuable.
Treat yourself like a product
The job market is a market. You want product market fit. You build features that the market cannot ignore.
A strong beginner profile is not someone who knows five tools superficially. It is someone who has solid foundations, a few real projects, and the ability to explain insights clearly.
A good model is this.
Be broadly capable and deeply strong in one area.
Week Zero Research and Setup
Week zero is not about learning tools. It is about setting your direction.
Step one decide if the role fits you
Ask yourself.
Do I enjoy solving puzzles and finding patterns
Do I enjoy explaining things simply
Do I like asking why and what if
Can I work with ambiguity
Can I stay consistent for months
If the answer is mostly yes, the path fits.
Step two define your target job category
Pick one category as your primary target for the first job.
BI reporting analyst
Tool specific analyst
Domain or function analyst
Full stack analyst
You can evolve later. But you need a target now to guide what you prioritize.
Step three set up your environment
You need a basic setup.
- A spreadsheet tool
- A BI tool
- A place to store project work such as GitHub or a portfolio page
- A system for notes and learning logs
- A weekly schedule for study and practice
Step four create a simple job skills tracker
Make a spreadsheet with three columns.
Skill name
My current level from one to five
Evidence I can show
Evidence is critical. It could be a dashboard, a SQL project, a case study write up, or a short presentation.
Weeks One and Two Excel Business Math and Basic Statistics
Excel remains a core tool in 2026. Even companies that use BI tools heavily still rely on spreadsheets for quick analysis, ad hoc requests, and stakeholder reviews.

What to learn in Excel
- Foundations
- Basic formulas such as sum, average, count
- Sorting and filtering
- Conditional formatting
- Data validation
- Basic charts
- Analysis and productivity
- Pivot tables and pivot charts
- Lookup logic using VLOOKUP and alternatives
- Index match concept
- Text and date functions
- Basic data cleaning techniques
- Simple dashboards inside spreadsheets
Business math you must be comfortable with
- Percent change
- Percent of total
- Ratios
- Averages and weighted averages
- Basic forecasting intuition
- Understanding variance
The reason this matters is simple.
Business teams speak in percentages and trends. If revenue moves from 50 to 60, the natural question is growth rate, not absolute change. Analysts must translate numbers into business language.
Basic statistics that actually help beginners
- Mean median mode
- Range and variability
- Correlation intuition
- Sampling idea and bias awareness
- Simple distributions
- Confidence at a conceptual level
You do not need deep probability theory at this stage. You need practical intuition.
Assignment for week one and two
Assignment one
Pick any public dataset and create a pivot driven summary that answers at least five questions.
Assignment two
Write a one page insight memo that includes three findings and two recommendations. Keep it simple, clear, and business focused.
Weeks Three Four and Five BI Tool Foundations
Pick one BI tool. If you are unsure, Power BI is a common default in many markets. If your region or target companies use Tableau or another tool, choose that instead.
The goal is to learn one tool well enough to build real dashboards with good modeling habits.
What you must learn in a BI tool
Data connection
Connecting to files and databases
Understanding refresh behavior
Data transformation
Cleaning, merging, shaping data
Handling missing values
Creating a consistent model ready dataset
Data modeling
Star schema concept at a beginner level
Fact tables and dimension tables
Relationships and filter direction
Why model quality affects dashboard performance
Measures and calculations
Basic calculated fields
Aggregation logic
Time based calculations concept
Visualization and dashboarding
Choosing the right chart for the question
Avoiding clutter
Building a dashboard that tells a story
Designing for stakeholders, not for yourself
Publishing and sharing
Workspace concept
Permissions basics
Refresh scheduling awareness
Assignment for weeks three to five
Do one unguided dashboard project.
Pick one of these domains.
- Retail sales performance
- Marketing funnel and campaigns
- Finance budget versus actual
- Operations and delivery metrics
- Customer support and satisfaction
Your dashboard must include.
- A clear business question
- At least three KPIs
- At least two drill downs
- A short written insight summary
Then publish your project as a portfolio item with screenshots and a short explanation.
Weeks Six Seven and Eight SQL Fundamentals
SQL is a required skill in most analyst roles. Even if you mainly use BI tools, SQL lets you answer questions faster and work directly with data sources.
What to learn in SQL
Database basics
Tables, rows, columns
Primary key and foreign key concept
Why joins exist
Core querying
SELECT and WHERE
DISTINCT
ORDER BY
GROUP BY
HAVING
CASE WHEN
Joins
Inner join
Left join
Right join concept
Full join concept
Join keys and common mistakes
Subqueries and CTE
Why CTE improves readability
How to break problems into steps
Window functions
ROW NUMBER
RANK and DENSE RANK
PARTITION BY concept
Running totals
Practical output thinking
Design queries that answer business questions
Write readable SQL with clear naming
Validate results with sanity checks
Assignment for weeks six to eight
Build a mini SQL project.
Pick a dataset and create ten business questions, then answer them with SQL.
Examples of business questions.
Which products drive the highest revenue
Which customer segment has the highest repeat rate
Which region has the highest growth
Which month has unusual variance and why
Store your queries in a clean format and publish them as a portfolio artifact.
Weeks Nine Data Engineering Basics and Stakeholder Skills
This is where you start separating yourself from the average beginner.
You do not need to become a data engineer. But you should understand the basics of how data arrives in a table and what can go wrong.
Data engineering basics for analysts
- What is ETL and ELT
- What is a data warehouse and why it exists
- What is a data lake conceptually
- What is a pipeline and scheduling
- What is an API at a practical level
- What is a transformation layer concept
Cloud familiarity basics
Know what AWS, Azure, and GCP are. Understand that many analytics stacks run on cloud services. You do not need to be certified. You need familiarity so you can collaborate.
Stakeholder management basics
Stakeholder management is not about speaking fancy English. It is about making your work predictable and easy to consume.
You must learn to do three things well.
Clarify requirements
Confirm definitions
Set expectations on time and scope
A simple requirement gathering framework
When you receive a request, ask.
- What decision will this support
- Who will use it
- What metric definition should we use
- What time period matters
- What is the expected output format
- When is it needed
- What trade offs are acceptable
Assignment for week nine
Pick one domain such as finance, marketing, retail, or healthcare.
Write five to seven questions you would ask a stakeholder before building a dashboard. Then write a short paragraph describing the business goal.
This assignment forces you to think like a consultant, not just a tool user.
Weeks Ten Eleven and Twelve Python and Pandas Plus AI Literacy
Python is not required for every analyst job, but it expands your options and increases your ability to work with messy data and advanced analysis.
Python basics to cover
- Variables and data types
- Lists, dictionaries, sets, tuples
- Conditionals
- Loops
- Functions
- Working with files
- Basic debugging habits
Pandas essentials
- Loading data
- Filtering and selecting
- Group by aggregations
- Merging datasets
- Handling missing values
- Creating new columns
- Date time processing
- Basic plotting awareness
AI literacy for analysts in 2026
You do not need to be a machine learning engineer. You do need enough AI literacy to stay relevant.
Know these at a practical level.
- What machine learning is
- What a model does and does not do
- What bias means in data and models
- How to use AI tools to speed up analysis
- How to validate AI generated outputs
- How to use AI as a second brain for documentation and planning
The best analysts use AI to accelerate routine work, then reinvest time into deeper thinking and better stakeholder collaboration.
Assignment for weeks ten to twelve
Create a portfolio post that includes.
A short video or written walkthrough that explains your project
A clear problem statement
A clear method
Three insights
Two actions
If you do not want to publish a video, do a written case study with visuals and strong clarity.
The goal is not perfection. The goal is building communication skill and confidence.
Weeks Thirteen and Fourteen Automation and Workflow Efficiency
Automation is becoming a quiet superpower for analysts. Many teams waste hours moving files, copying data, sending reminders, and manually updating reports.
If you can automate small workflows, you save time and become more valuable.
What to learn
- Difference between no code and low code tools
- Basics of Power Automate, Zapier, or Make
- Common triggers and actions
- Connecting tools and moving data
- Simple notification workflows
- Basic scheduling logic
Practical automation examples for beginners
- Auto collect form responses into a spreadsheet
- Auto notify a team when data refresh fails
- Auto archive reports to a shared folder
- Auto create weekly summary messages
You do not need complex automation. You need practical wins.
Assignment for weeks thirteen and fourteen
Build one automation that saves time in a realistic workflow and document it.
Write a short case study.
What was the manual process
What did you automate
How much time it saves weekly
What risks you handled
This can be a standout portfolio item because most beginners do not show it.
Weeks Fifteen and Sixteen Portfolio Refinement and Interview Preparation
By this point, you should have core foundations and multiple artifacts.
Now you focus on packaging and interview readiness.
What your beginner portfolio should include
- One Excel analysis project
- One BI dashboard project
- One SQL project with business questions
- One Python or pandas analysis notebook
- One short insight memo or stakeholder style write up
- Optional one automation case study
Resume strategy for beginners
Do not list tools only. Show outcomes.
Use this structure for bullets.
- What you built
- What problem it solves
- What insight it enables
- What business value it supports
Example structure.
Built a sales performance dashboard with weekly refresh and KPI definitions that improved visibility into regional revenue drivers and reduced manual reporting time
Even without job experience, you can write strong bullets based on projects if the projects are real and well documented.
Interview preparation focus areas
- SQL question practice
- Dashboard design and KPI explanation
- Case study storytelling
- Requirement gathering role play
- Explaining insights in plain language
- Handling data quality questions
Assignment for weeks fifteen and sixteen
Apply to jobs weekly while refining your portfolio.
Keep improving one project to make it unique, not copied.
Common ways to make a project unique.
- Add a new metric that was not in the base dataset documentation
- Add a clean executive summary view
- Add performance improvements in the model
- Add a what changed and why section
- Add a recommendation section tied to revenue, cost, or risk
How to Choose a Domain So You Stand Out
In 2026, domain knowledge is a major edge. Even basic domain familiarity helps.
Pick one function or domain to learn alongside tools.
Functions you can choose.
- Marketing
- Finance
- Sales
- Supply chain
- Customer experience
- Human resources
- Operations
Domains you can choose.
- Retail
- Consumer goods
- Healthcare
- Banking
- Energy
- Gaming
- Manufacturing
How to build domain knowledge as a beginner
- Learn common KPIs and definitions
- Read annual reports and understand revenue and cost
- Study a basic profit and loss statement
- Follow a few companies and understand their business model
- Build projects using domain specific questions
If you understand revenue, cost, and profit, you can connect almost any analysis to business value.
What Makes a Data Analyst Valuable in 2026
If you remember only one section of this blog, remember this.
Technical skills alone do not secure roles long term. Many routine tasks are becoming faster with AI and modern tooling.
The analyst who wins in 2026 is the one who can do these things consistently.
- Solve real business problems
- Ask better questions than others
- Communicate insights clearly
- Collaborate across teams
- Understand business context
- Use tools efficiently, not worship tools
- Keep learning with curiosity and discipline
The best way to think about your career is not as a tool collector. It is as a problem solver.
Tools will change. Problem solving stays.
Your Beginner Checklist for the Next Four to Six Months
Use this as a simple tracking list. Turn each item into evidence.
- Excel fundamentals and pivot analysis
- Business math and percent thinking
- Basic statistics intuition
- One BI tool proficiency
- Data modeling fundamentals
- SQL including joins and window functions
- One BI dashboard project with story
- One SQL project with ten questions
- Stakeholder requirement questions practice
- Python basics and pandas workflows
- One analysis case study write up
- One automation mini project
- A clean portfolio page
- A resume that highlights outcomes
- Weekly job applications with iteration
The more items you complete with proof, the closer you get to interviews.
Final Thoughts
A data analyst road map is not about learning everything. It is about learning the right foundations, practicing with real projects, and communicating insights like a professional.
If you are willing to study consistently for four to six months, build proof through projects, and develop business communication, data analyst is still a strong path in 2026.
Industry Reports and Research Referenced
This road map is not based on opinions, trends from social media, or isolated success stories. It is grounded in labor market data, economic research, and independent studies from globally respected institutions. Below are the key reports that informed the direction, priorities, and realism of this guide.
World Economic Forum – The Future of Jobs Report 2025
The World Economic Forum’s Future of Jobs Report 2025 provides one of the most comprehensive global outlooks on how roles are evolving due to automation, AI, and digital transformation.
Key insights relevant to aspiring data analysts include:
- Data analysts and data related roles continue to rank among the fastest growing job categories globally
- Demand is shifting from task execution toward analytical thinking, problem solving, and business interpretation
- Roles that combine technical literacy with human judgment are more resilient to automation
- Employers increasingly value cross functional skills, not just tool expertise
This directly supports the emphasis in this roadmap on problem solving, domain knowledge, and communication, not just dashboards and SQL.
Source
World Economic Forum – The Future of Jobs Report 2025
https://www.weforum.org/publications/the-future-of-jobs-report-2025/
US Bureau of Labor Statistics – Fastest Growing Occupations
The US Bureau of Labor Statistics provides long term, data backed projections for occupational growth across industries.
According to BLS projections:
- Data related roles, including analysts and analytical specialists, are expected to grow faster than the average of all occupations
- Growth is driven by the increasing use of data in business strategy, operations, healthcare, finance, and technology
- Employers continue to prioritize roles that support decision making and efficiency, not just reporting
These projections reinforce that data analytics is not a short term trend, but a structurally growing function across industries.
Source
US Bureau of Labor Statistics – Fastest Growing Occupations
https://www.bls.gov/ooh/fastest-growing.htm
MIT Research – Why Most Generative AI Pilots Fail
One of the most misunderstood topics in 2026 is the impact of AI on data analyst roles. Many assume AI will fully replace analysts. MIT research paints a very different picture.
This MIT backed report highlights that:
- Approximately 95 percent of generative AI pilots fail to deliver expected business value
- The primary reasons for failure are not technical, but organizational, strategic, and human
- AI struggles when business problems are poorly defined or when insights are not clearly communicated
- Human judgment, domain understanding, and decision framing remain critical
This directly supports the roadmap’s emphasis on analysts becoming problem solvers and collaborators, not passive report generators.
Source
MIT Report on Generative AI Adoption and Failure Rates
https://fortune.com/2025/08/18/mit-report-95-percent-generative-ai-pilots-at-companies-failing-cfo/
MIT CSAIL Study – The Economic Limits of Job Automation
Another major MIT CSAIL study explores the real economic boundaries of automation, challenging the idea that AI can easily replace complex analytical roles.
Key findings include:
- Many tasks are technically automatable but not economically viable to automate
- Jobs that require context, judgment, interpretation, and communication are far more resistant to full automation
- Hybrid roles that combine technical tools with human reasoning will dominate future job markets
This reinforces why data analysts who understand business context, stakeholder needs, and strategic trade offs will remain highly valuable.
Source
MIT CSAIL – Rethinking AI’s Impact on Jobs
https://www.csail.mit.edu/news/rethinking-ais-impact-mit-csail-study-reveals-economic-limits-job-automation
Why These Reports Matter for Beginners
Together, these reports support a clear conclusion.
- Data analyst is still a strong career path in 2026
- The role is evolving, not disappearing
- Tool only analysts are at risk
- Problem solvers with business context are in demand
This is why the roadmap focuses on:
- Building strong foundations instead of chasing shortcuts
- Developing communication and domain knowledge alongside technical skills
- Treating AI as a productivity multiplier, not a replacement
- Positioning yourself as a decision support professional, not just a report builder
If you align your preparation with these realities, you are not preparing for yesterday’s data analyst role. You are preparing for the version of the role companies are actually hiring for now.
Data Analyst Road Map for Beginners 2026 – FAQs
1. Is data analyst still a good career in 2026
Yes. Data analyst is still a strong career in 2026 for people who focus on problem solving, business understanding, and communication, not just building reports.
2. Is data analyst a good entry point into data and AI
Yes. Data analyst is one of the most practical gateway roles into data and AI because it builds foundations in data thinking, business context, and analytics tools.
3. Will AI replace data analysts in 2026
AI will not fully replace data analysts. It will replace repetitive reporting tasks. Analysts who provide insights, context, and decision support will remain in demand.
4. What kind of data analysts are at risk in 2026
Analysts who only pull data and create basic dashboards without understanding business context or decision making are at the highest risk.
5. What does a data analyst actually do in 2026
A data analyst collects data, cleans and models it, analyzes patterns, communicates insights, supports decisions, and measures outcomes.
6. How is the data analyst role changing
The role is shifting from report building to problem solving, stakeholder collaboration, and business impact driven analysis.
7. Do beginners still get hired as data analysts
Yes. Beginners get hired when they show proof of skills through projects, portfolios, and clear communication, not just certificates.
8. How long does it take to become a data analyst as a beginner
With consistent effort, most beginners can build job ready skills in four to six months.
9. How many hours should I study per day
A realistic expectation is about four hours of focused study and practice on most days.
10. Is watching tutorials enough to become a data analyst
No. Watching tutorials without building projects and proof of work rarely leads to interviews in 2026.
11. What are the core technical skills for a data analyst in 2026
Excel, a BI tool, SQL, basic statistics, Python basics, data modeling, and data cleaning are core technical skills.
12. Do I need to learn Excel in 2026
Yes. Excel is still widely used for ad hoc analysis, validation, and stakeholder communication.
13. Which BI tool should beginners learn
Power BI is a common default, but Tableau or other tools are fine if they align with your target job market.
14. Is SQL mandatory for data analysts
Yes. SQL is required in most analyst roles to query and validate data directly.
15. How much statistics do I need as a beginner
You need practical intuition such as averages, variability, correlation, and basic distributions, not advanced math.
16. Is Python required for data analyst jobs
Not always, but Python increases your job options and helps with complex analysis and data preparation.
17. Do I need to learn cloud platforms as a beginner
You need familiarity, not expertise. Understanding how data lives in cloud systems helps collaboration and context.
18. What is data modeling and why does it matter
Data modeling defines how tables relate. Good models improve performance, accuracy, and dashboard clarity.
19. What is basic data engineering awareness
It means understanding how data is collected, transformed, stored, and refreshed, even if you do not build pipelines.
20. Are automation skills useful for data analysts
Yes. Automation saves time and increases value by reducing manual and repetitive work.
21. What core skills matter most for data analysts in 2026
Problem solving, communication, stakeholder management, data storytelling, and business understanding.
22. Why are communication skills important for data analysts
Insights only create value when stakeholders understand and act on them.
23. What is data storytelling
Data storytelling means explaining insights clearly using visuals, narrative, and business language.
24. What is stakeholder management for data analysts
It is the ability to clarify requirements, set expectations, and deliver predictable outcomes.
25. Why is domain knowledge important
Domain knowledge helps analysts ask better questions and deliver insights that matter to the business.
26. Can beginners build domain knowledge
Yes. Beginners can learn KPIs, business models, and industry basics through reports, projects, and case studies.
27. What mindset do successful beginners need
Discipline, curiosity, consistency, and willingness to build proof of work.
28. Should I chase trending tools
No. Tools change. Problem solving and business thinking remain valuable.
29. What does treating yourself like a product mean
It means building skills and evidence that the job market cannot ignore.
30. Is it better to know many tools or one deeply
It is better to be broadly capable with deep strength in one area.
31. What are the main types of data analyst roles
BI reporting analyst, tool specific analyst, domain or function analyst, and full stack analyst.
32. Which data analyst roles are beginner friendly
BI reporting analyst and tool specific analyst roles are most beginner friendly.
33. What is a BI reporting analyst
A BI reporting analyst builds recurring reports and dashboards using predefined metrics.
34. What is a tool specific analyst
A tool specific analyst focuses deeply on one BI tool such as Power BI or Tableau.
35. What is a domain specific analyst
A domain specific analyst applies analytics within a specific business function or industry.
36. What is a full stack data analyst
A full stack analyst understands analytics and basic data engineering workflows end to end.
37. Should beginners aim for full stack roles
Beginners can aim for it gradually, but should first build strong analytics foundations.
38. How do I choose my target role
Choose based on your interests, existing experience, and job postings in your market.
39. Can I switch categories later
Yes. Many analysts move across categories as they gain experience.
40. Does AI make full stack skills more important
Yes. AI increases demand for analysts who understand data flows and system context.
41. What should a beginner data analyst portfolio include
Excel analysis, BI dashboard, SQL project, insight write up, and optional automation or Python work.
42. How many projects do I need as a beginner
Three to five well explained projects are better than many shallow ones.
43. What makes a portfolio project strong
Clear problem statement, clean analysis, insights, and business recommendations.
44. Should I copy tutorial projects
No. Always modify projects to make them unique and reflect your thinking.
45. Do I need video presentations in my portfolio
Not mandatory, but videos improve communication skills and confidence.
46. How important is LinkedIn for data analysts
Very important. It is a professional marketplace for visibility, networking, and opportunities.
47. What should I focus on in my resume as a beginner
Outcomes, insights, and value delivered, not just tool lists.
48. How do I prepare for data analyst interviews
Practice SQL, explain dashboards, tell project stories, and role play stakeholder discussions.
49. What separates strong candidates in interviews
Clarity of thought, business understanding, and ability to explain insights simply.
50. What is the biggest mistake beginners make
Learning tools without building proof of work and business context.